
One-Dimensional Singles
Images can be described as two-dimensional signals. One standard method of image processing is to apply a 1D function to each row, and then apply it to each column. As SeDDaRA can be applied to 1D signals.
Here we have some examples of application of SeDDaRA to 1D signals.
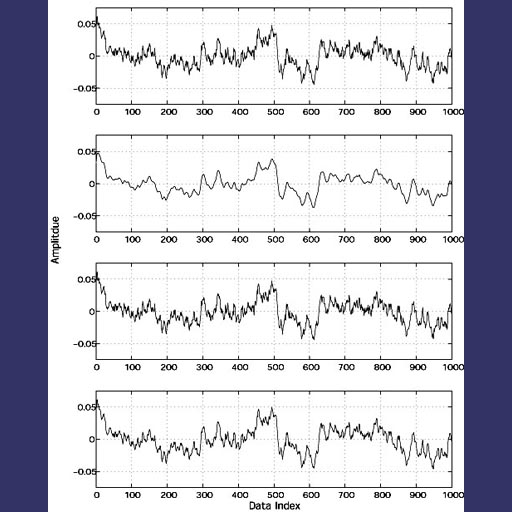
This plot is from our paper on application to 1D signals. The top signal is original. The next one was convolvued with a filter to reduce the resolution. The third and fourth are SeDDaRA deconvolutions.

This is a signal created by a combination of sine waves.

This is the output wave from a speaker and recorded on a computer.

This is the deconvolution of that signal using SeDDaRA
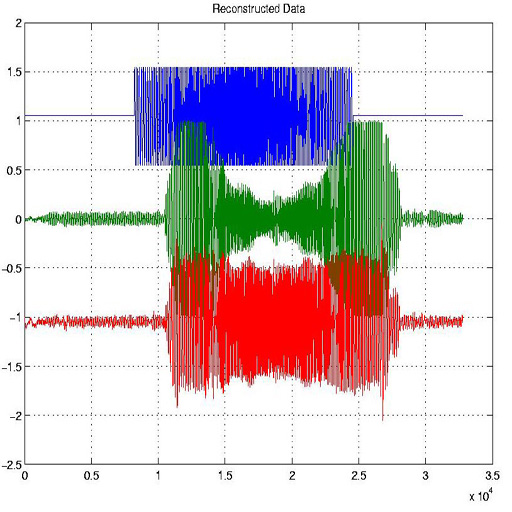
This is another example having a truth image, a distorted signal, and a reconstructed signal.
We have not explored this space for some time. If you have an application idea, we would love to hear it.