 Quarktet proudly announces the latest release of the PulseView program, enabling quick viewing and analysis of text-based data files. PulseView allows users to quickly open and view data files, open large data files, perform quick analysis, apply basic math operations, and "sonify" the data...much quicker than spreadsheets! The above is a screen shot of the PulseView program. The Control Panel, to the left, puts the main functions closer to the user. Image contrast controls are contained in the same window as the image, allowing easy access. Image statistics, histograms, and a log of user events are included.
The motivation for this program is that a lot of valuable research time is wasted by creating graphs when all one wants to do is validate the data. The two most popular methods of viewing text-based data files are spreadsheet programs, like Microsoft Excel, and scripting programs, such as Matlab.
To view a plot of data in Excel:
- one has to first wait for the program to open,
- set the format type to text, data, or csv
- instruct the program which delimiter to use
- go through the graph wizard to plot the correct columns
The user has to follow these steps for each data file. Microsoft could make this process a lot easier if they wanted to. Since they have not, this suggests that researchers are not their most important market.
To view a plot with Matlab:
- one must first wait for the program to open

- learn the correct plotting commands, or
- create a script that will run through the commands
- loop through the errors while continuously checking the help file
- spend more time trying to find where the save function is.
Once you have perform these tasks, you have already justified the expense of PulseView. When all you want to do is look at your data, these programs are overkill.
With some initial setup, double clicking on a data file will open PulseView and show the graph.
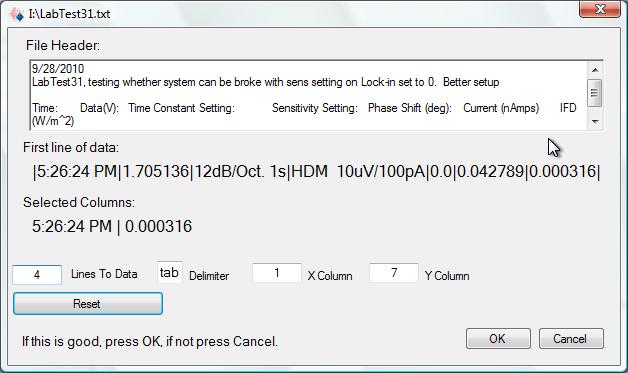
The initialization in itself is easy. Open PulseView, click the File button, choose your format and the graph is displayed. Close PulseView, and your settings are saved for the next data set.
Check out the list of Features PulseView has a full help menu complete with step-through examples and processing hints.The demo can run for 15 days before purchase is required.
